Backup/Meinberg
Report generated: Sat Jul 5 15:43:00 2025 UTCStart Time: Sat Jun 28 15:43:00 2025 UTC
End Time: Sat Jul 5 15:43:00 2025 UTC
Report Period: 7.0 days
Daily stats Weekly stats
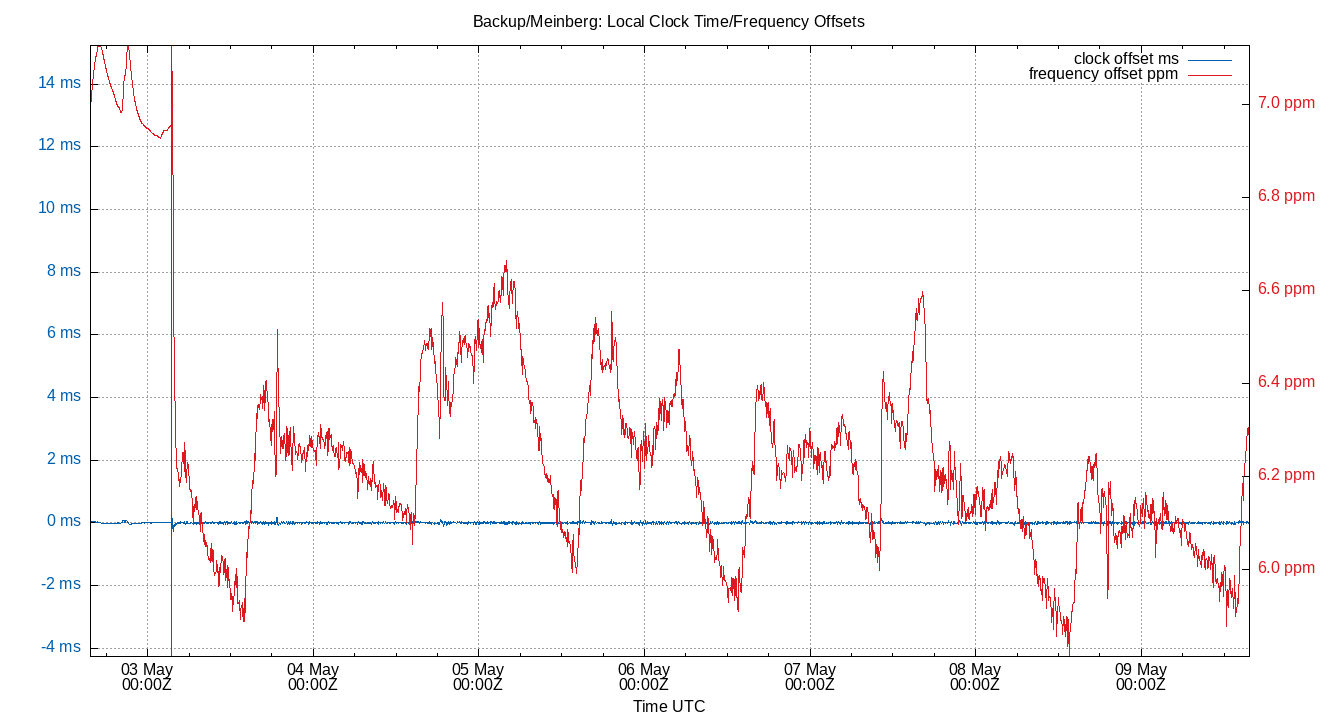
Local Clock Time/Frequency Offsets
| Percentiles...... | Ranges...... | Skew- | Kurt- | |||||||||||||
| Name | Min | 1% | 5% | 50% | 95% | 99% | Max | 90% | 98% | StdDev | Mean | Units | ness | osis | ||
| Local Clock Time Offset | -83.073 | -53.141 | -18.371 | -3.423 | 25.015 | 107.677 | 165.087 | 43.386 | 160.818 | 20.832 | -0.101 | µs | 2.698 | 20.56 | ||
| Local Clock Frequency Offset | 5.589 | 5.598 | 5.639 | 6.097 | 6.612 | 6.752 | 6.768 | 0.974 | 1.154 | 0.298 | 6.129 | ppm | 0.1469 | 2.161 | ||
The time and frequency offsets between the ntpd calculated time and the local system clock. Showing frequency offset (red, in parts per million, scale on right) and the time offset (blue, in μs, scale on left). Quick changes in time offset will lead to larger frequency offsets.
These are fields 3 (time) and 4 (frequency) from the loopstats log file.
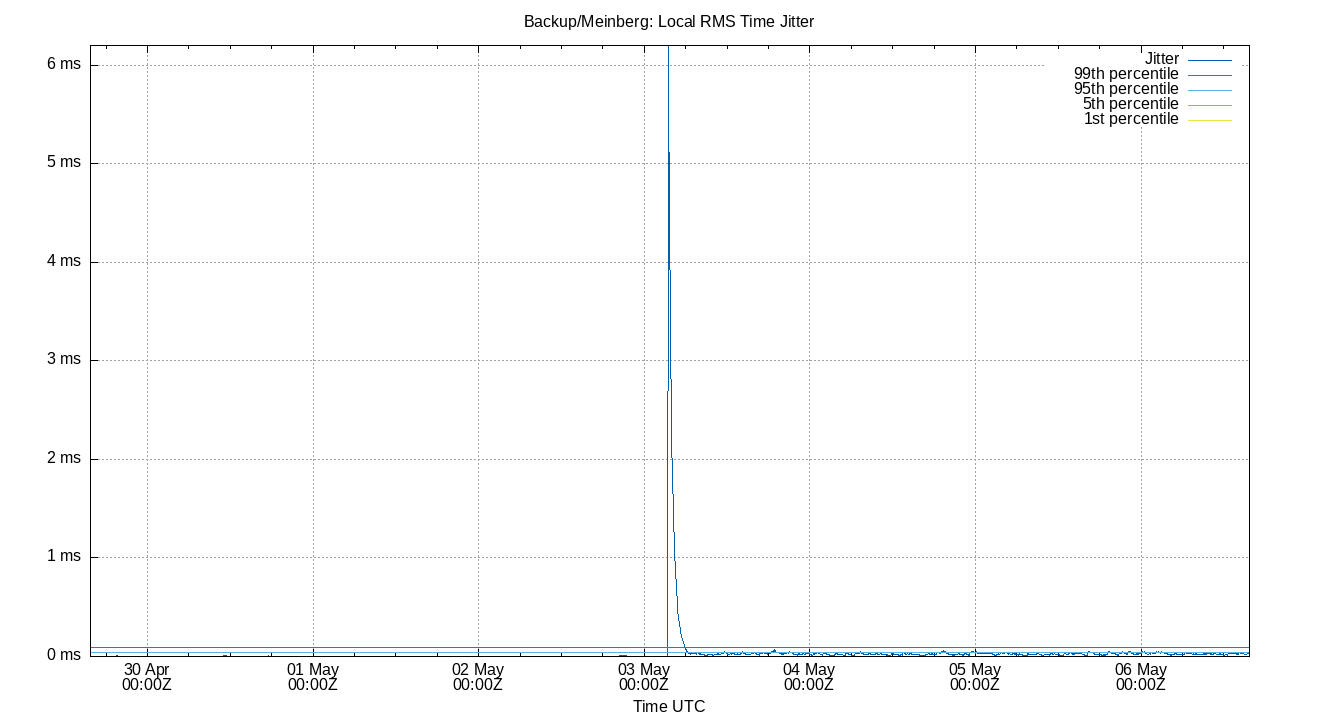
Local RMS Time Jitter
| Percentiles...... | Ranges...... | Skew- | Kurt- | |||||||||||||
| Name | Min | 1% | 5% | 50% | 95% | 99% | Max | 90% | 98% | StdDev | Mean | Units | ness | osis | ||
| Local RMS Time Jitter | 0.344 | 0.467 | 0.549 | 0.813 | 2.509 | 6.938 | 12.232 | 1.960 | 6.471 | 1.040 | 1.069 | µs | 5.561 | 40.52 | ||
The RMS Jitter of the local clock offset. In other words, how fast the local clock offset is changing.
Lower is better. An ideal system would be a horizontal line at 0μs.
RMS jitter is field 5 in the loopstats log file.
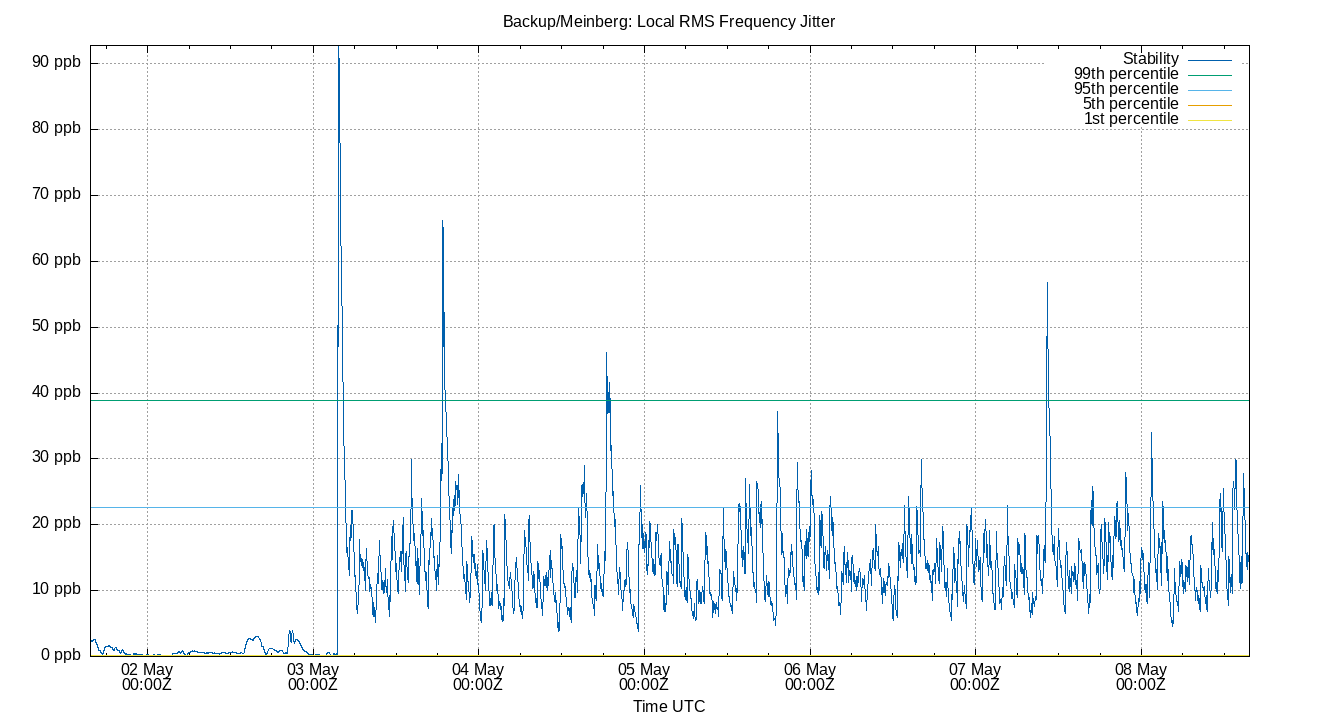
Local RMS Frequency Jitter
| Percentiles...... | Ranges...... | Skew- | Kurt- | |||||||||||||
| Name | Min | 1% | 5% | 50% | 95% | 99% | Max | 90% | 98% | StdDev | Mean | Units | ness | osis | ||
| Local RMS Frequency Jitter | 0.045 | 0.097 | 0.143 | 0.577 | 1.848 | 6.128 | 9.369 | 1.705 | 6.031 | 0.985 | 0.804 | ppb | 4.608 | 29.69 | ||
The RMS Frequency Jitter (aka wander) of the local clock's frequency. In other words, how fast the local clock changes frequency.
Lower is better. An ideal clock would be a horizontal line at 0ppm.
RMS Frequency Jitter is field 6 in the loopstats log file.
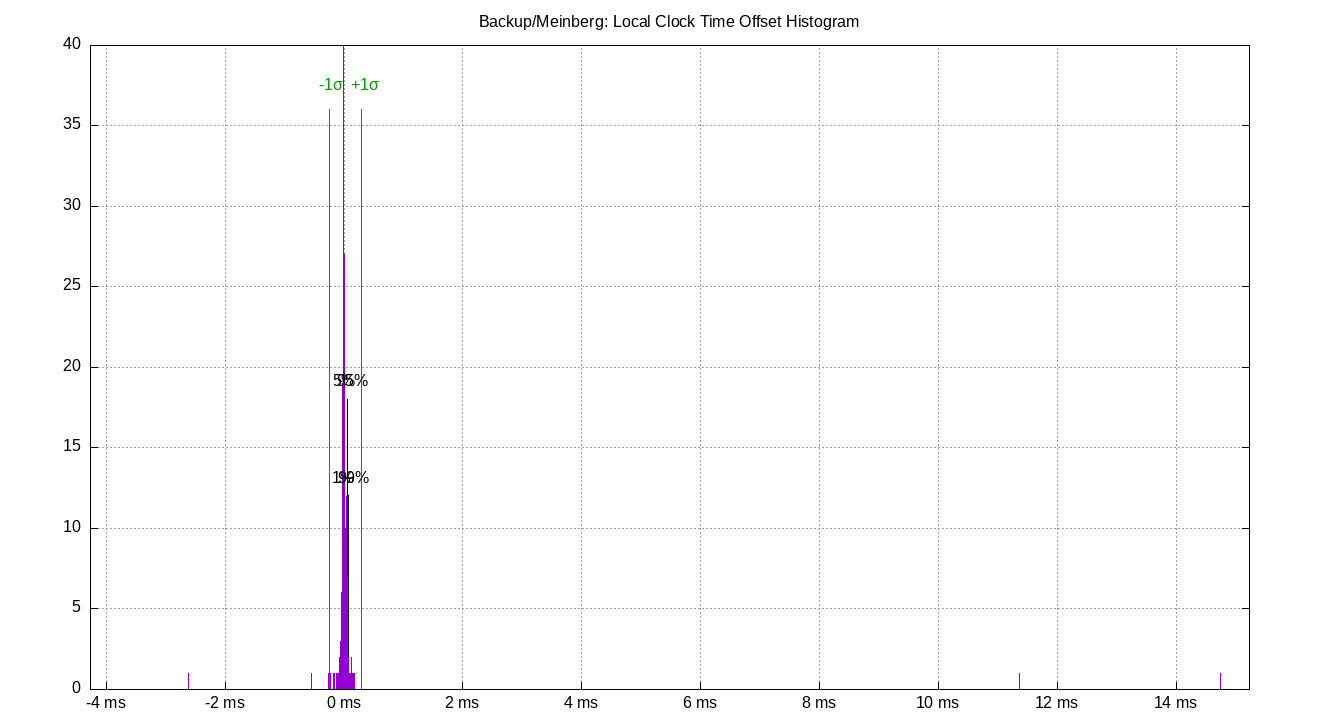
Local Clock Time Offset Histogram
| Percentiles...... | Ranges...... | Skew- | Kurt- | |||||||||||||
| Name | Min | 1% | 5% | 50% | 95% | 99% | Max | 90% | 98% | StdDev | Mean | Units | ness | osis | ||
| Local Clock Offset | -83.073 | -53.141 | -18.371 | -3.423 | 25.015 | 107.677 | 165.087 | 43.386 | 160.818 | 20.832 | -0.101 | µs | 2.698 | 20.56 | ||
The clock offsets of the local clock as a histogram.
The Local Clock Offset is field 3 from the loopstats log file.
Local Temperatures
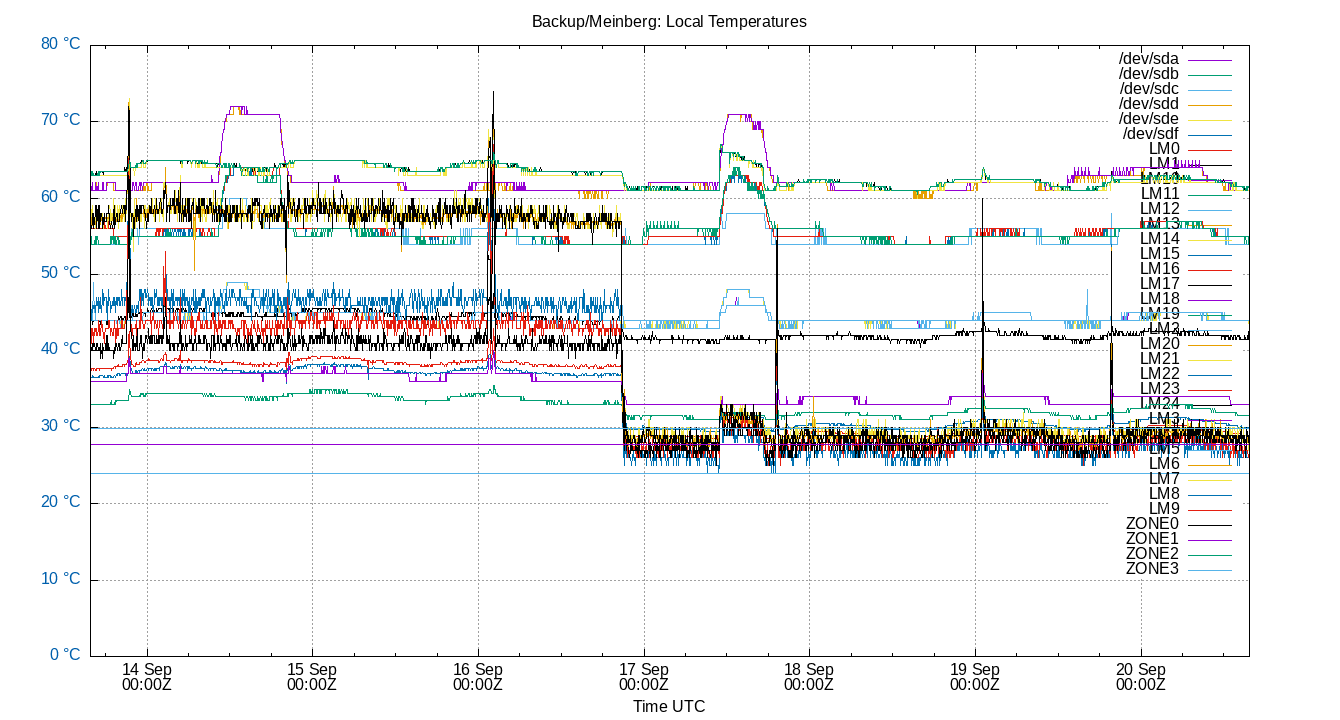
Local temperatures. These will be site-specific depending upon what temperature sensors you collect data from. Temperature changes affect the local clock crystal frequency and stability. The math of how temperature changes frequency is complex, and also depends on crystal aging. So there is no easy way to correct for it in software. This is the single most important component of frequency drift.
The Local Temperatures are from field 3 from the tempstats log file.
Local Frequency/Temp
| Percentiles...... | Ranges...... | Skew- | Kurt- | |||||||||||||
| Name | Min | 1% | 5% | 50% | 95% | 99% | Max | 90% | 98% | StdDev | Mean | Units | ness | osis | ||
| Local Clock Frequency Offset | 5.589 | 5.598 | 5.639 | 6.097 | 6.612 | 6.752 | 6.768 | 0.974 | 1.154 | 0.298 | 6.129 | ppm | 0.1469 | 2.161 | ||
| Temp /dev/sda | 44.000 | 44.000 | 45.000 | 47.000 | 49.000 | 50.000 | 52.000 | 4.000 | 6.000 | 1.347 | 46.926 | °C | ||||
| Temp /dev/sdb | 55.000 | 55.000 | 56.000 | 58.000 | 63.000 | 67.000 | 68.000 | 7.000 | 12.000 | 2.460 | 58.004 | °C | ||||
| Temp /dev/sdc | 56.000 | 56.000 | 56.000 | 58.000 | 61.000 | 61.000 | 67.000 | 5.000 | 5.000 | 1.506 | 58.396 | °C | ||||
| Temp /dev/sdd | 61.000 | 61.000 | 62.000 | 64.000 | 71.000 | 76.000 | 76.000 | 9.000 | 15.000 | 2.826 | 65.063 | °C | ||||
| Temp /dev/sdf | 55.000 | 55.000 | 56.000 | 58.000 | 64.000 | 68.000 | 69.000 | 8.000 | 13.000 | 2.621 | 58.772 | °C | ||||
| Temp LM0 | 28.750 | 28.750 | 29.000 | 31.250 | 34.750 | 41.500 | 47.250 | 5.750 | 12.750 | 2.150 | 31.582 | °C | ||||
| Temp LM1 | 41.500 | 42.000 | 42.500 | 44.000 | 46.500 | 46.500 | 47.000 | 4.000 | 4.500 | 1.215 | 44.323 | °C | ||||
| Temp LM10 | 0.000 | 0.000 | 0.000 | 0.000 | 0.000 | 0.000 | 0.000 | 0.000 | 0.000 | 0.000 | 0.000 | °C | ||||
| Temp LM11 | 44.000 | 44.000 | 45.000 | 47.000 | 49.000 | 50.000 | 52.000 | 4.000 | 6.000 | 1.347 | 46.926 | °C | ||||
| Temp LM12 | 27.800 | 27.800 | 27.800 | 27.800 | 27.800 | 27.800 | 27.800 | 0.000 | 0.000 | 0.000 | 27.800 | °C | ||||
| Temp LM13 | 29.800 | 29.800 | 29.800 | 29.800 | 29.800 | 29.800 | 29.800 | 0.000 | 0.000 | 0.000 | 29.800 | °C | ||||
| Temp LM14 | 30.000 | 30.000 | 30.250 | 32.500 | 35.500 | 38.000 | 41.750 | 5.250 | 8.000 | 1.767 | 32.781 | °C | ||||
| Temp LM15 | 55.000 | 55.000 | 56.000 | 58.000 | 64.000 | 69.000 | 69.000 | 8.000 | 14.000 | 2.631 | 58.939 | °C | ||||
| Temp LM16 | 61.000 | 61.000 | 61.500 | 63.500 | 66.000 | 69.500 | 71.500 | 4.500 | 8.500 | 1.648 | 63.810 | °C | ||||
| Temp LM17 | 61.000 | 62.000 | 63.000 | 65.000 | 72.000 | 76.000 | 77.000 | 9.000 | 14.000 | 2.795 | 65.282 | °C | ||||
| Temp LM18 | 55.000 | 55.000 | 56.000 | 58.000 | 63.000 | 68.000 | 68.000 | 7.000 | 13.000 | 2.495 | 58.164 | °C | ||||
| Temp LM19 | 27.000 | 28.000 | 28.000 | 30.000 | 34.000 | 67.000 | 80.000 | 6.000 | 39.000 | 4.937 | 31.174 | °C | ||||
| Temp LM2 | 33.000 | 33.000 | 33.000 | 36.000 | 38.000 | 38.000 | 41.000 | 5.000 | 5.000 | 1.386 | 35.640 | °C | ||||
| Temp LM20 | 26.000 | 27.000 | 28.000 | 30.000 | 34.000 | 65.000 | 80.000 | 6.000 | 38.000 | 4.762 | 30.699 | °C | ||||
| Temp LM21 | 24.000 | 25.000 | 25.000 | 28.000 | 31.000 | 61.000 | 76.000 | 6.000 | 36.000 | 4.588 | 28.494 | °C | ||||
| Temp LM22 | 25.000 | 26.000 | 27.000 | 30.000 | 34.000 | 60.000 | 73.000 | 7.000 | 34.000 | 4.464 | 30.531 | °C | ||||
| Temp LM23 | 26.000 | 27.000 | 27.000 | 29.000 | 33.000 | 59.000 | 72.000 | 6.000 | 32.000 | 4.160 | 30.014 | °C | ||||
| Temp LM3 | 31.500 | 31.500 | 32.000 | 34.500 | 37.000 | 37.500 | 37.500 | 5.000 | 6.000 | 1.642 | 34.432 | °C | ||||
| Temp LM4 | 24.000 | 24.000 | 24.000 | 24.000 | 24.000 | 24.000 | 24.000 | 0.000 | 0.000 | 0.000 | 24.000 | °C | ||||
| Temp LM5 | 30.500 | 30.500 | 30.500 | 30.500 | 30.500 | 30.500 | 30.500 | 0.000 | 0.000 | 0.000 | 30.500 | °C | ||||
| Temp LM6 | 61.000 | 61.000 | 61.000 | 63.000 | 66.000 | 69.000 | 71.000 | 5.000 | 8.000 | 1.704 | 63.522 | °C | ||||
| Temp LM7 | 0.000 | 0.000 | 0.000 | 0.000 | 0.000 | 0.000 | 0.000 | 0.000 | 0.000 | 0.000 | 0.000 | °C | ||||
| Temp LM8 | 0.000 | 0.000 | 0.000 | 0.000 | 0.000 | 0.000 | 0.000 | 0.000 | 0.000 | 0.000 | 0.000 | °C | ||||
| Temp LM9 | 0.000 | 0.000 | 0.000 | 0.000 | 0.000 | 0.000 | 0.000 | 0.000 | 0.000 | 0.000 | 0.000 | °C | ||||
| Temp ZONE0 | 26.000 | 27.000 | 28.000 | 30.000 | 34.000 | 67.000 | 81.000 | 6.000 | 40.000 | 5.006 | 30.873 | °C | ||||
| Temp ZONE1 | 27.800 | 27.800 | 27.800 | 27.800 | 27.800 | 27.800 | 27.800 | 0.000 | 0.000 | 0.000 | 27.800 | °C | ||||
| Temp ZONE2 | 61.000 | 61.500 | 61.500 | 63.500 | 66.000 | 69.500 | 71.500 | 4.500 | 8.000 | 1.645 | 63.812 | °C | ||||
| Temp ZONE3 | 29.800 | 29.800 | 29.800 | 29.800 | 29.800 | 29.800 | 29.800 | 0.000 | 0.000 | 0.000 | 29.800 | °C | ||||
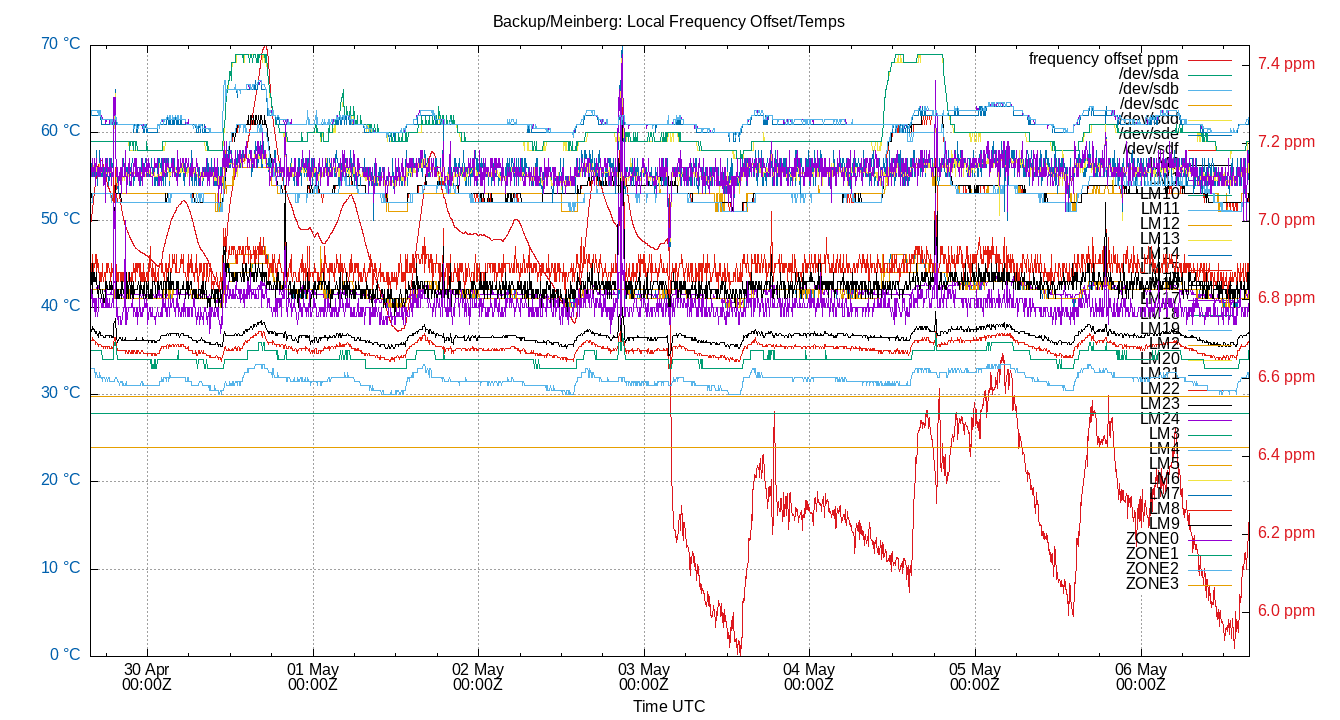
The frequency offsets and temperatures. Showing frequency offset (red, in parts per million, scale on right) and the temperatures.
These are field 4 (frequency) from the loopstats log file, and field 3 from the tempstats log file.
Server Offsets
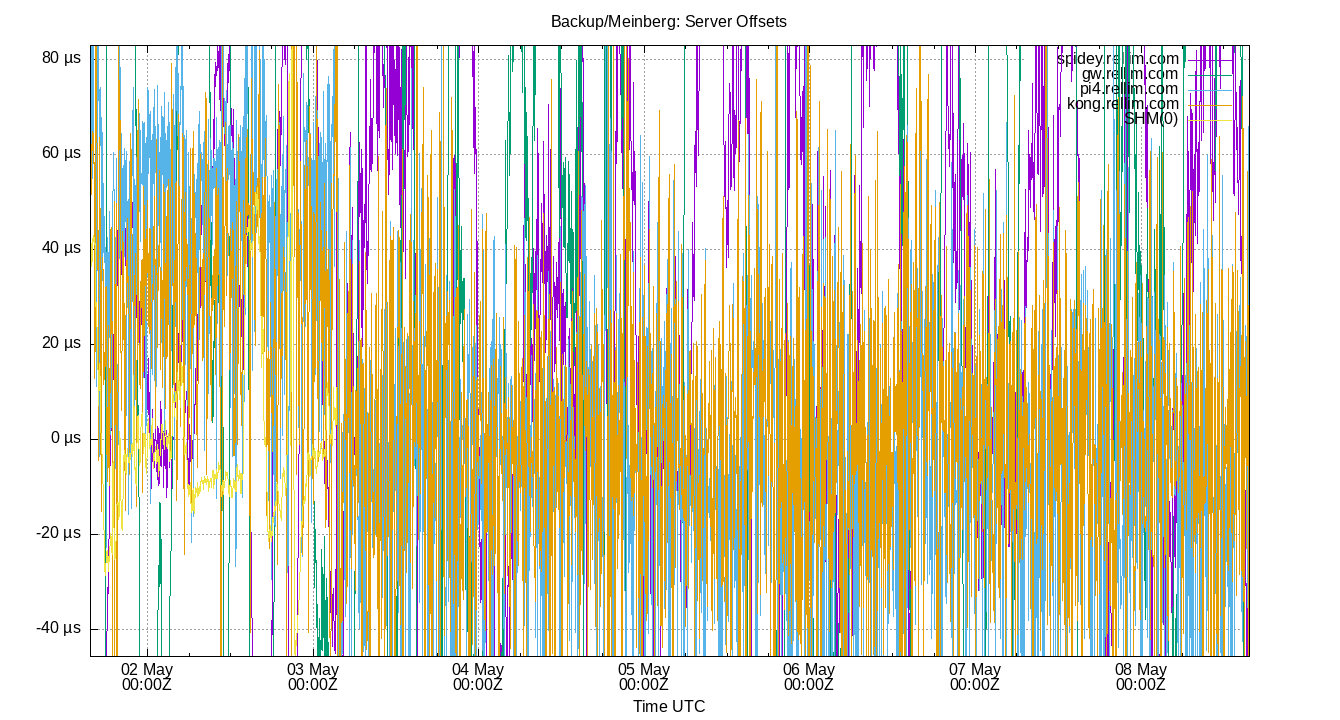
The offset of all refclocks and servers. This can be useful to see if offset changes are happening in a single clock or all clocks together.
Clock Offset is field 5 in the peerstats log file.
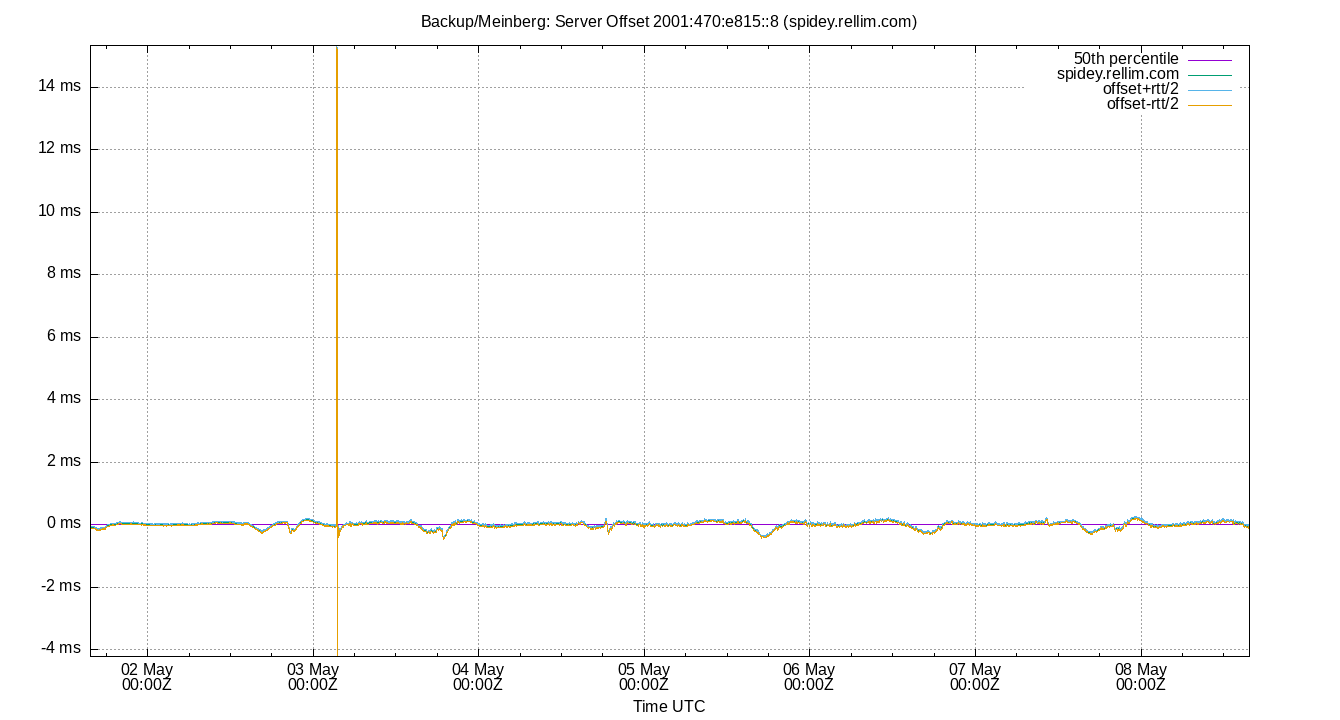
Server Offset 2001:470:e815::8 (spidey.rellim.com)
| Percentiles...... | Ranges...... | Skew- | Kurt- | |||||||||||||
| Name | Min | 1% | 5% | 50% | 95% | 99% | Max | 90% | 98% | StdDev | Mean | Units | ness | osis | ||
| Server Offset 2001:470:e815::8 (spidey.rellim.com) | -628.529 | -410.700 | -160.463 | 30.480 | 180.966 | 481.323 | 611.053 | 341.429 | 892.023 | 134.889 | 24.429 | µs | 0.001095 | 7.236 | ||
The offset of a server in seconds. This is useful to see how the measured offset is behaving.
The chart also plots offset±rtt, where rtt is the round trip time to the server. NTP can not really know the offset of a remote chimer, NTP computes it by subtracting rtt/2 from the offset. Plotting the offset±rtt reverses this calculation to more easily see the effects of rtt changes.
Closer to 0s is better. An ideal system would be a horizontal line at 0s. Typical 90% ranges may be: local LAN server 80µs; 90% ranges for WAN server may be 4ms and much larger.
Clock Offset is field 5 in the peerstats log file. The Round Trip Time (rtt) is field 6 in the peerstats log file.
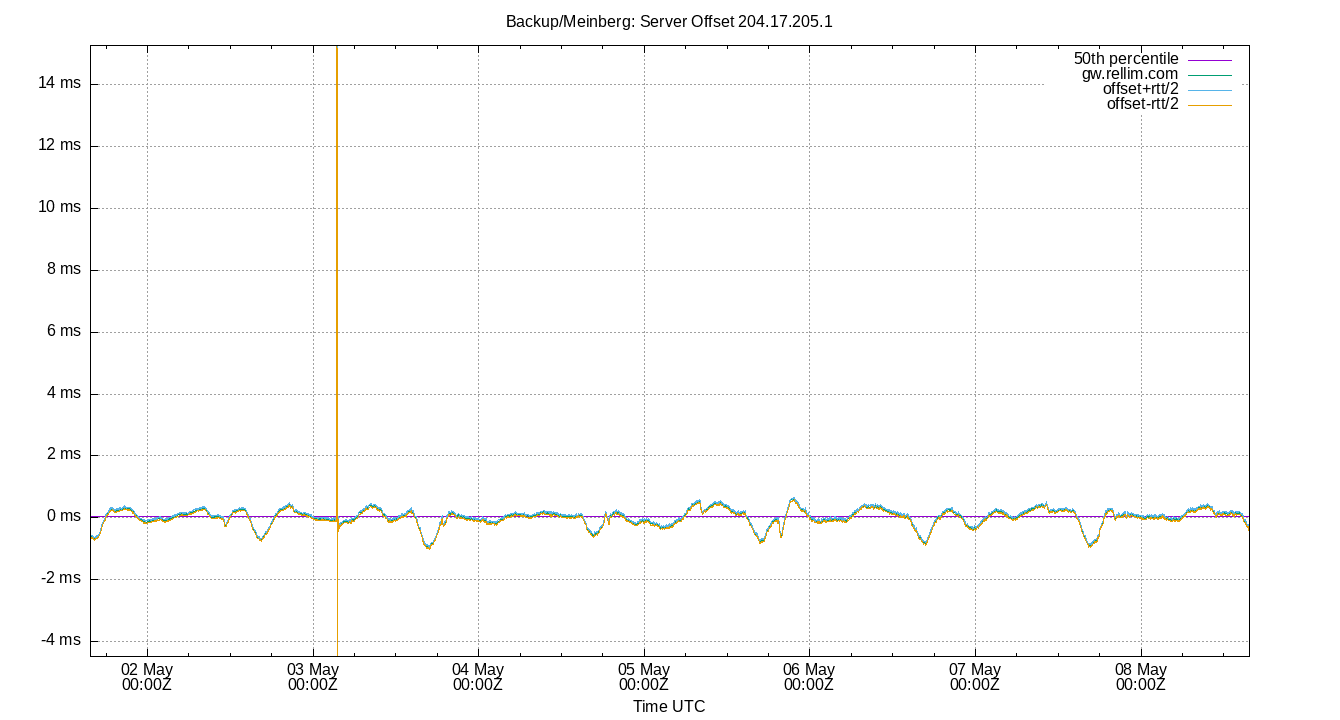
Server Offset 204.17.205.1
| Percentiles...... | Ranges...... | Skew- | Kurt- | |||||||||||||
| Name | Min | 1% | 5% | 50% | 95% | 99% | Max | 90% | 98% | StdDev | Mean | Units | ness | osis | ||
| Server Offset 204.17.205.1 | -2.187 | -0.946 | -0.496 | 0.022 | 0.565 | 1.144 | 1.509 | 1.061 | 2.090 | 0.361 | 0.011 | ms | -0.5004 | 9.715 | ||
The offset of a server in seconds. This is useful to see how the measured offset is behaving.
The chart also plots offset±rtt, where rtt is the round trip time to the server. NTP can not really know the offset of a remote chimer, NTP computes it by subtracting rtt/2 from the offset. Plotting the offset±rtt reverses this calculation to more easily see the effects of rtt changes.
Closer to 0s is better. An ideal system would be a horizontal line at 0s. Typical 90% ranges may be: local LAN server 80µs; 90% ranges for WAN server may be 4ms and much larger.
Clock Offset is field 5 in the peerstats log file. The Round Trip Time (rtt) is field 6 in the peerstats log file.
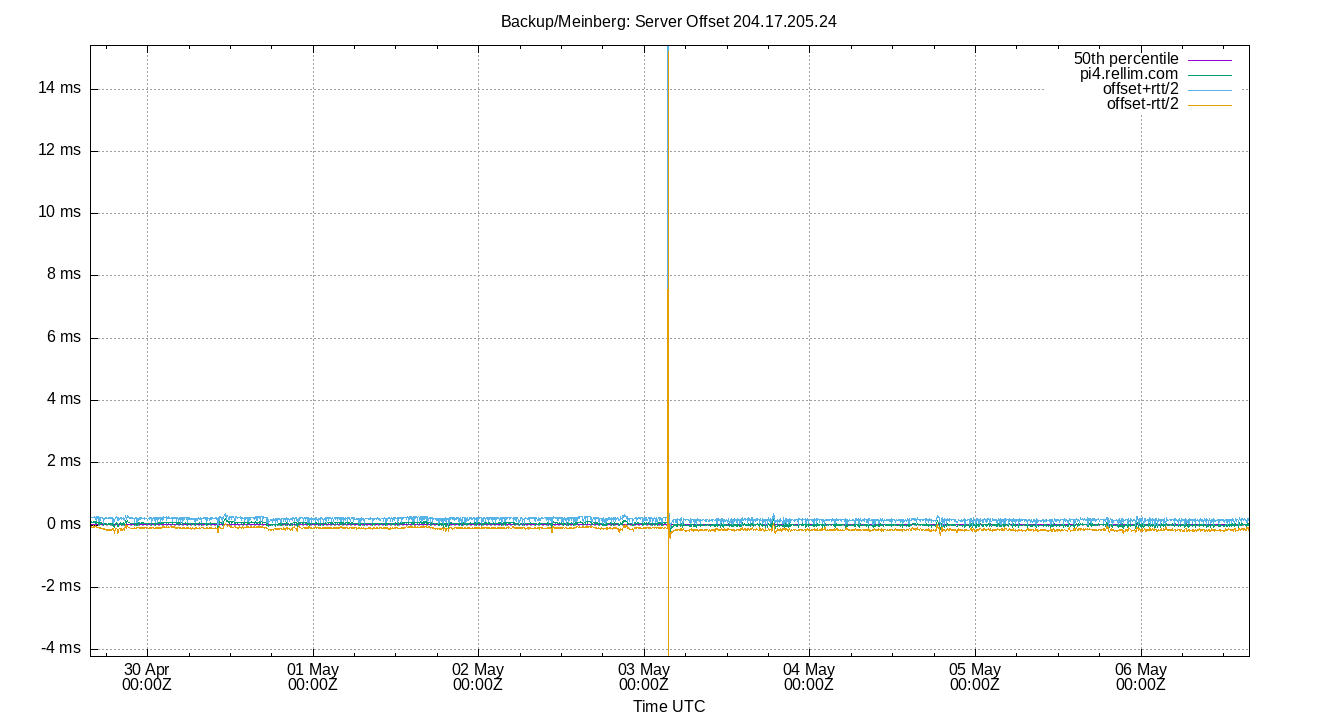
Server Offset 204.17.205.24
| Percentiles...... | Ranges...... | Skew- | Kurt- | |||||||||||||
| Name | Min | 1% | 5% | 50% | 95% | 99% | Max | 90% | 98% | StdDev | Mean | Units | ness | osis | ||
| Server Offset 204.17.205.24 | -107.163 | -46.087 | -14.880 | 48.260 | 88.343 | 151.802 | 247.142 | 103.223 | 197.889 | 34.045 | 45.045 | µs | 0.3142 | 7.028 | ||
The offset of a server in seconds. This is useful to see how the measured offset is behaving.
The chart also plots offset±rtt, where rtt is the round trip time to the server. NTP can not really know the offset of a remote chimer, NTP computes it by subtracting rtt/2 from the offset. Plotting the offset±rtt reverses this calculation to more easily see the effects of rtt changes.
Closer to 0s is better. An ideal system would be a horizontal line at 0s. Typical 90% ranges may be: local LAN server 80µs; 90% ranges for WAN server may be 4ms and much larger.
Clock Offset is field 5 in the peerstats log file. The Round Trip Time (rtt) is field 6 in the peerstats log file.
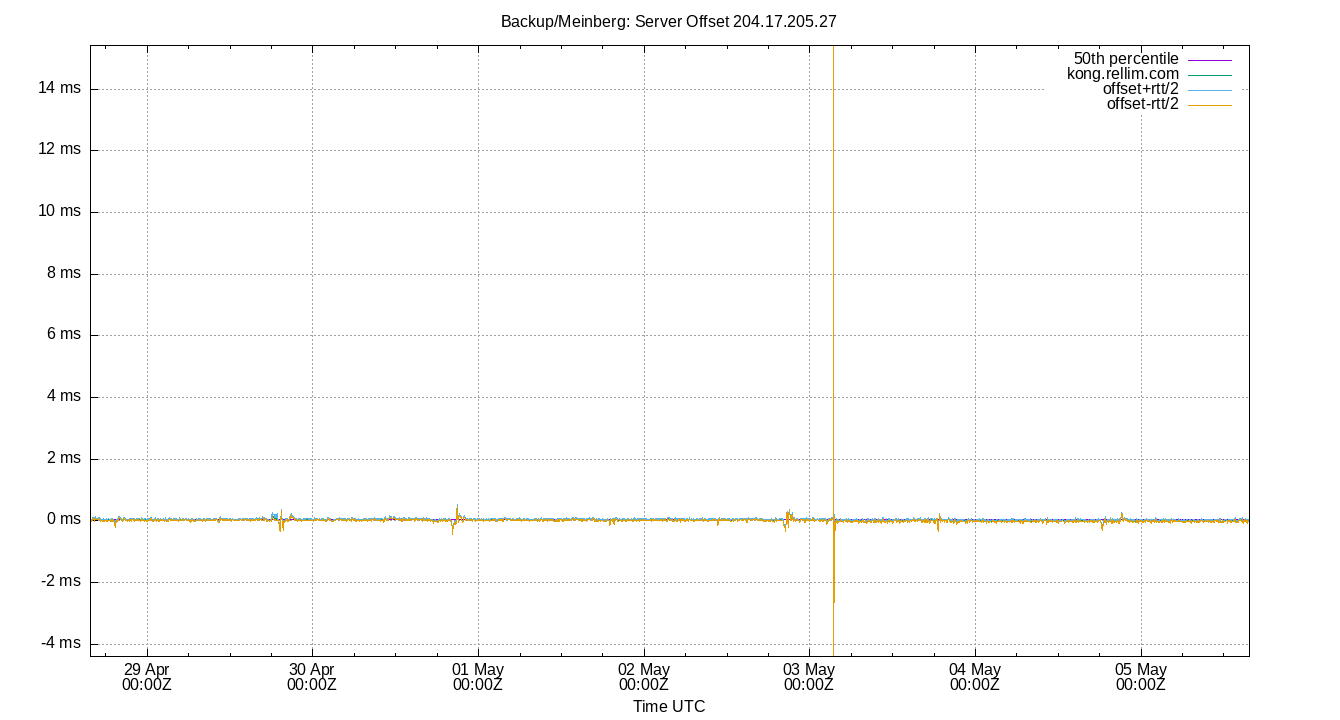
Server Offset 204.17.205.27
| Percentiles...... | Ranges...... | Skew- | Kurt- | |||||||||||||
| Name | Min | 1% | 5% | 50% | 95% | 99% | Max | 90% | 98% | StdDev | Mean | Units | ness | osis | ||
| Server Offset 204.17.205.27 | -238.745 | -56.557 | -1.659 | 46.606 | 94.314 | 148.900 | 469.461 | 95.973 | 205.457 | 36.514 | 46.201 | µs | 0.8087 | 19.71 | ||
The offset of a server in seconds. This is useful to see how the measured offset is behaving.
The chart also plots offset±rtt, where rtt is the round trip time to the server. NTP can not really know the offset of a remote chimer, NTP computes it by subtracting rtt/2 from the offset. Plotting the offset±rtt reverses this calculation to more easily see the effects of rtt changes.
Closer to 0s is better. An ideal system would be a horizontal line at 0s. Typical 90% ranges may be: local LAN server 80µs; 90% ranges for WAN server may be 4ms and much larger.
Clock Offset is field 5 in the peerstats log file. The Round Trip Time (rtt) is field 6 in the peerstats log file.
Server Offset SHM(0)
.png)
| Percentiles...... | Ranges...... | Skew- | Kurt- | |||||||||||||
| Name | Min | 1% | 5% | 50% | 95% | 99% | Max | 90% | 98% | StdDev | Mean | Units | ness | osis | ||
| Server Offset SHM(0) | -83.074 | -53.142 | -18.372 | -3.424 | 25.016 | 107.678 | 165.088 | 43.388 | 160.820 | 20.833 | -0.101 | µs | 2.697 | 20.56 | ||
The offset of a server in seconds. This is useful to see how the measured offset is behaving.
The chart also plots offset±rtt, where rtt is the round trip time to the server. NTP can not really know the offset of a remote chimer, NTP computes it by subtracting rtt/2 from the offset. Plotting the offset±rtt reverses this calculation to more easily see the effects of rtt changes.
Closer to 0s is better. An ideal system would be a horizontal line at 0s. Typical 90% ranges may be: local LAN server 80µs; 90% ranges for WAN server may be 4ms and much larger.
Clock Offset is field 5 in the peerstats log file. The Round Trip Time (rtt) is field 6 in the peerstats log file.
Server Jitters
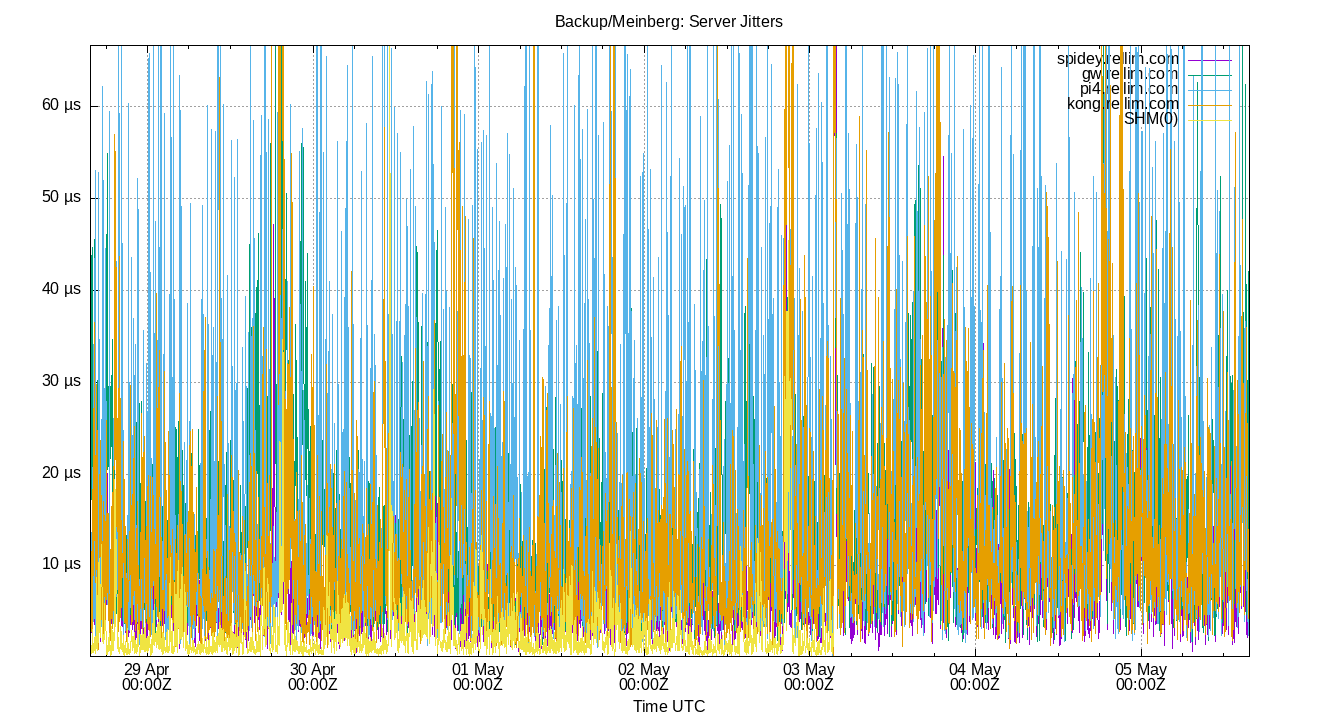
The RMS Jitter of all refclocks and servers. Jitter is the current estimated dispersion, in other words the variation in offset between samples.
Closer to 0s is better. An ideal system would be a horizontal line at 0s.
RMS Jitter is field 8 in the peerstats log file.
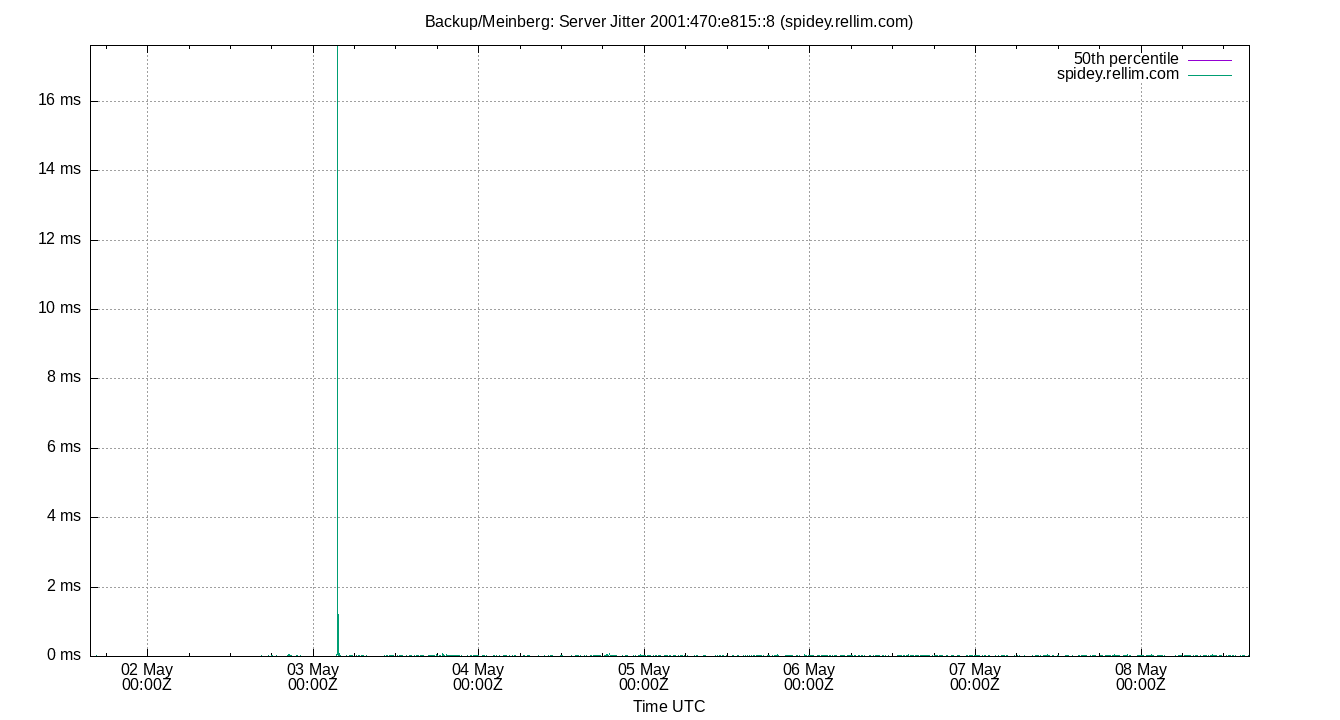
Server Jitter 2001:470:e815::8 (spidey.rellim.com)
| Percentiles...... | Ranges...... | Skew- | Kurt- | |||||||||||||
| Name | Min | 1% | 5% | 50% | 95% | 99% | Max | 90% | 98% | StdDev | Mean | Units | ness | osis | ||
| Server Jitter 2001:470:e815::8 (spidey.rellim.com) | 0.810 | 2.921 | 4.752 | 12.924 | 58.799 | 83.973 | 145.768 | 54.047 | 81.052 | 17.971 | 20.078 | µs | 1.924 | 7.173 | ||
The RMS Jitter of a server. Jitter is the current estimated dispersion, in other words the variation in offset between samples.
Closer to 0s is better. An ideal system would be a horizontal line at 0s.
RMS Jitter is field 8 in the peerstats log file.
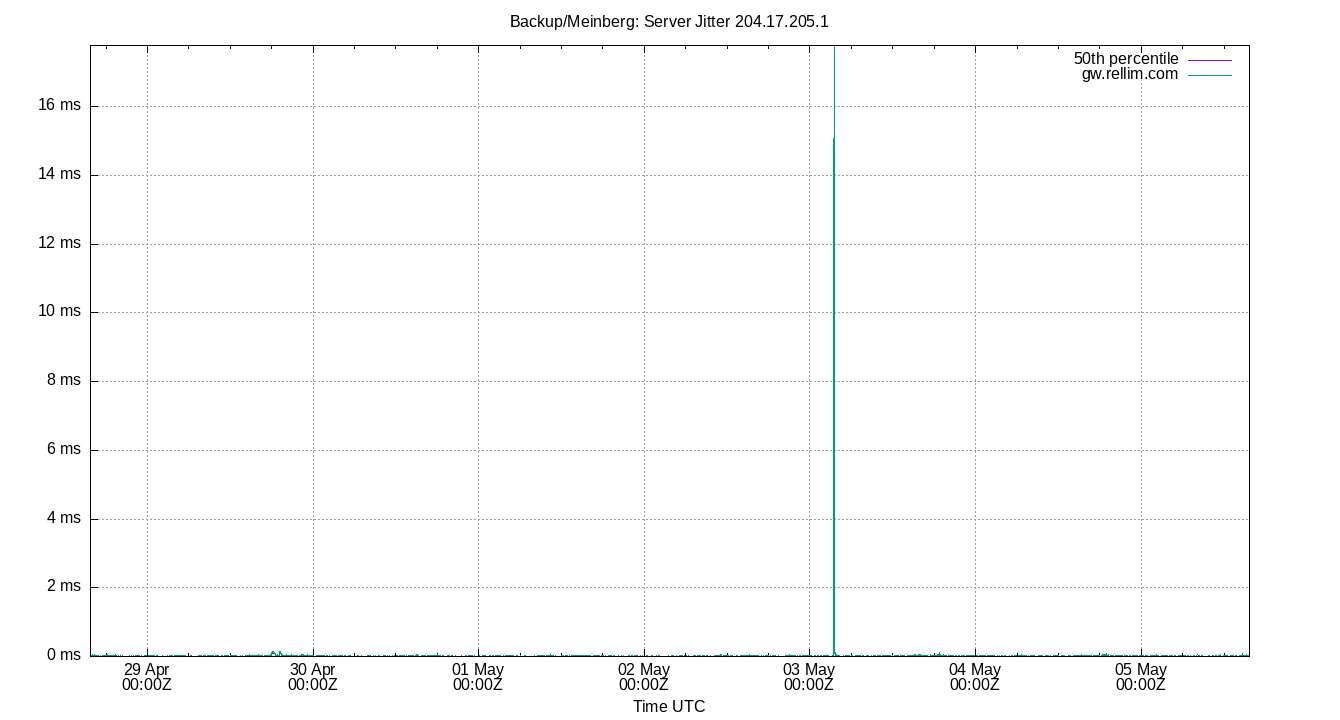
Server Jitter 204.17.205.1
| Percentiles...... | Ranges...... | Skew- | Kurt- | |||||||||||||
| Name | Min | 1% | 5% | 50% | 95% | 99% | Max | 90% | 98% | StdDev | Mean | Units | ness | osis | ||
| Server Jitter 204.17.205.1 | 1.831 | 3.783 | 5.265 | 12.226 | 32.104 | 70.366 | 182.247 | 26.839 | 66.583 | 12.670 | 15.197 | µs | 5.166 | 44.45 | ||
The RMS Jitter of a server. Jitter is the current estimated dispersion, in other words the variation in offset between samples.
Closer to 0s is better. An ideal system would be a horizontal line at 0s.
RMS Jitter is field 8 in the peerstats log file.
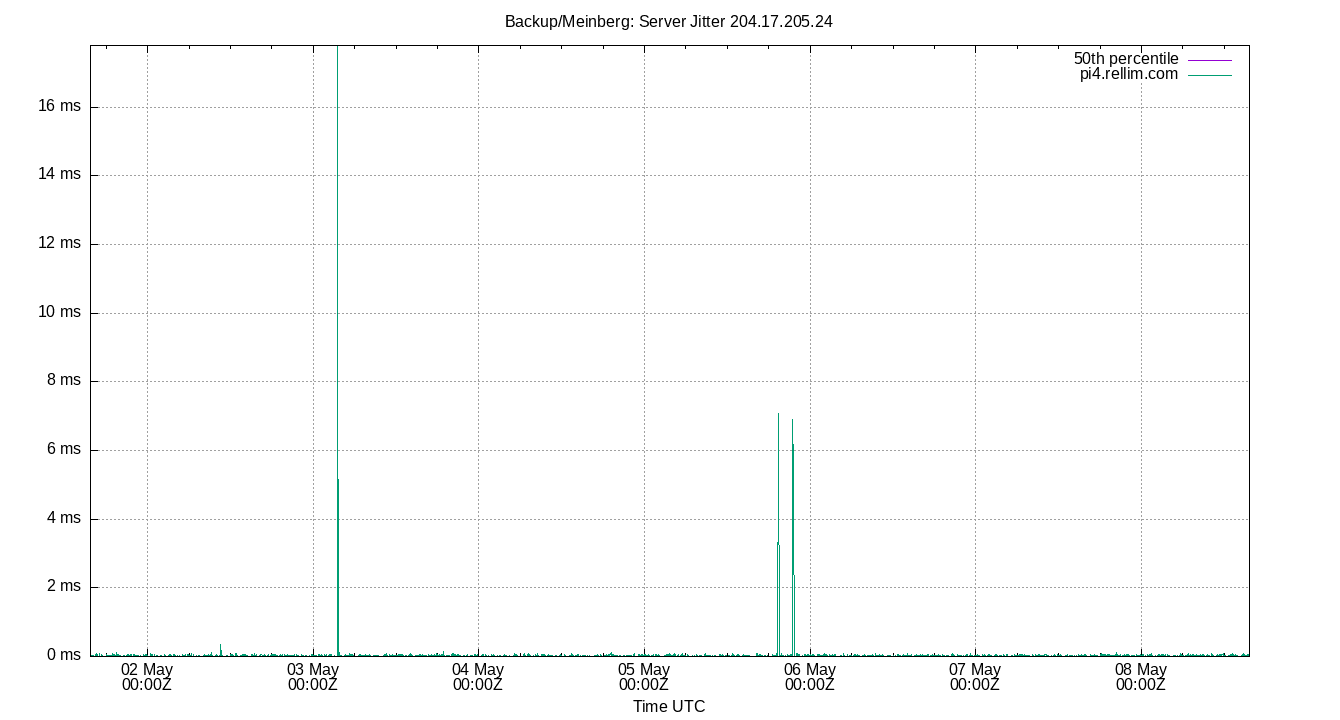
Server Jitter 204.17.205.24
| Percentiles...... | Ranges...... | Skew- | Kurt- | |||||||||||||
| Name | Min | 1% | 5% | 50% | 95% | 99% | Max | 90% | 98% | StdDev | Mean | Units | ness | osis | ||
| Server Jitter 204.17.205.24 | 1.355 | 4.088 | 6.192 | 23.862 | 87.602 | 131.465 | 226.158 | 81.410 | 127.377 | 25.784 | 30.490 | µs | 2.571 | 11.86 | ||
The RMS Jitter of a server. Jitter is the current estimated dispersion, in other words the variation in offset between samples.
Closer to 0s is better. An ideal system would be a horizontal line at 0s.
RMS Jitter is field 8 in the peerstats log file.
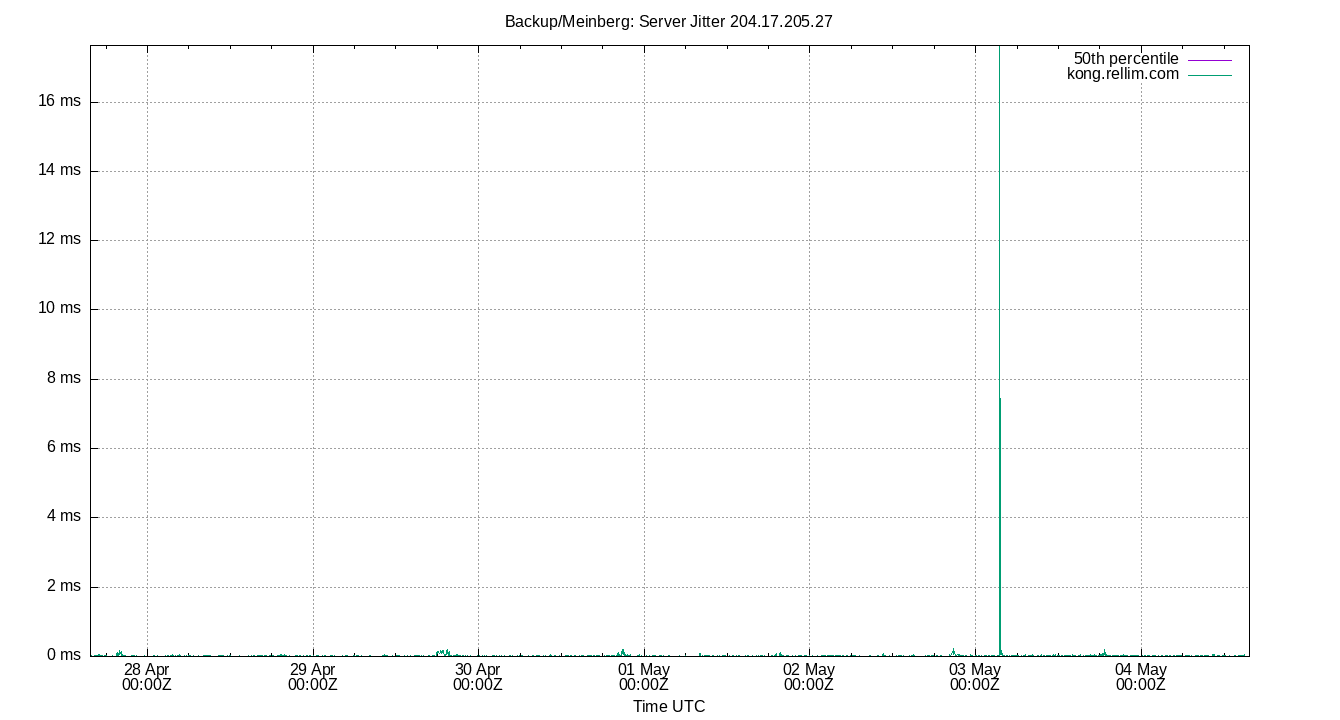
Server Jitter 204.17.205.27
| Percentiles...... | Ranges...... | Skew- | Kurt- | |||||||||||||
| Name | Min | 1% | 5% | 50% | 95% | 99% | Max | 90% | 98% | StdDev | Mean | Units | ness | osis | ||
| Server Jitter 204.17.205.27 | 0.968 | 3.210 | 4.879 | 11.646 | 43.764 | 97.599 | 167.034 | 38.885 | 94.389 | 16.672 | 16.684 | µs | 3.859 | 23.27 | ||
The RMS Jitter of a server. Jitter is the current estimated dispersion, in other words the variation in offset between samples.
Closer to 0s is better. An ideal system would be a horizontal line at 0s.
RMS Jitter is field 8 in the peerstats log file.
Server Jitter SHM(0)
.png)
| Percentiles...... | Ranges...... | Skew- | Kurt- | |||||||||||||
| Name | Min | 1% | 5% | 50% | 95% | 99% | Max | 90% | 98% | StdDev | Mean | Units | ness | osis | ||
| Server Jitter SHM(0) | 0.158 | 0.373 | 0.566 | 1.887 | 6.688 | 25.656 | 67.163 | 6.122 | 25.283 | 4.637 | 2.889 | µs | 7.305 | 70.95 | ||
The RMS Jitter of a server. Jitter is the current estimated dispersion, in other words the variation in offset between samples.
Closer to 0s is better. An ideal system would be a horizontal line at 0s.
RMS Jitter is field 8 in the peerstats log file.
Summary
| Percentiles...... | Ranges...... | Skew- | Kurt- | |||||||||||||
| Name | Min | 1% | 5% | 50% | 95% | 99% | Max | 90% | 98% | StdDev | Mean | Units | ness | osis | ||
| Local Clock Frequency Offset | 5.589 | 5.598 | 5.639 | 6.097 | 6.612 | 6.752 | 6.768 | 0.974 | 1.154 | 0.298 | 6.129 | ppm | 0.1469 | 2.161 | ||
| Local Clock Time Offset | -83.073 | -53.141 | -18.371 | -3.423 | 25.015 | 107.677 | 165.087 | 43.386 | 160.818 | 20.832 | -0.101 | µs | 2.698 | 20.56 | ||
| Local RMS Frequency Jitter | 0.045 | 0.097 | 0.143 | 0.577 | 1.848 | 6.128 | 9.369 | 1.705 | 6.031 | 0.985 | 0.804 | ppb | 4.608 | 29.69 | ||
| Local RMS Time Jitter | 0.344 | 0.467 | 0.549 | 0.813 | 2.509 | 6.938 | 12.232 | 1.960 | 6.471 | 1.040 | 1.069 | µs | 5.561 | 40.52 | ||
| Server Jitter 2001:470:e815::8 (spidey.rellim.com) | 0.810 | 2.921 | 4.752 | 12.924 | 58.799 | 83.973 | 145.768 | 54.047 | 81.052 | 17.971 | 20.078 | µs | 1.924 | 7.173 | ||
| Server Jitter 204.17.205.1 | 1.831 | 3.783 | 5.265 | 12.226 | 32.104 | 70.366 | 182.247 | 26.839 | 66.583 | 12.670 | 15.197 | µs | 5.166 | 44.45 | ||
| Server Jitter 204.17.205.24 | 1.355 | 4.088 | 6.192 | 23.862 | 87.602 | 131.465 | 226.158 | 81.410 | 127.377 | 25.784 | 30.490 | µs | 2.571 | 11.86 | ||
| Server Jitter 204.17.205.27 | 0.968 | 3.210 | 4.879 | 11.646 | 43.764 | 97.599 | 167.034 | 38.885 | 94.389 | 16.672 | 16.684 | µs | 3.859 | 23.27 | ||
| Server Jitter SHM(0) | 0.158 | 0.373 | 0.566 | 1.887 | 6.688 | 25.656 | 67.163 | 6.122 | 25.283 | 4.637 | 2.889 | µs | 7.305 | 70.95 | ||
| Server Offset 2001:470:e815::8 (spidey.rellim.com) | -628.529 | -410.700 | -160.463 | 30.480 | 180.966 | 481.323 | 611.053 | 341.429 | 892.023 | 134.889 | 24.429 | µs | 0.001095 | 7.236 | ||
| Server Offset 204.17.205.1 | -2.187 | -0.946 | -0.496 | 0.022 | 0.565 | 1.144 | 1.509 | 1.061 | 2.090 | 0.361 | 0.011 | ms | -0.5004 | 9.715 | ||
| Server Offset 204.17.205.24 | -107.163 | -46.087 | -14.880 | 48.260 | 88.343 | 151.802 | 247.142 | 103.223 | 197.889 | 34.045 | 45.045 | µs | 0.3142 | 7.028 | ||
| Server Offset 204.17.205.27 | -238.745 | -56.557 | -1.659 | 46.606 | 94.314 | 148.900 | 469.461 | 95.973 | 205.457 | 36.514 | 46.201 | µs | 0.8087 | 19.71 | ||
| Server Offset SHM(0) | -83.074 | -53.142 | -18.372 | -3.424 | 25.016 | 107.678 | 165.088 | 43.388 | 160.820 | 20.833 | -0.101 | µs | 2.697 | 20.56 | ||
| Temp /dev/sda | 44.000 | 44.000 | 45.000 | 47.000 | 49.000 | 50.000 | 52.000 | 4.000 | 6.000 | 1.347 | 46.926 | °C | ||||
| Temp /dev/sdb | 55.000 | 55.000 | 56.000 | 58.000 | 63.000 | 67.000 | 68.000 | 7.000 | 12.000 | 2.460 | 58.004 | °C | ||||
| Temp /dev/sdc | 56.000 | 56.000 | 56.000 | 58.000 | 61.000 | 61.000 | 67.000 | 5.000 | 5.000 | 1.506 | 58.396 | °C | ||||
| Temp /dev/sdd | 61.000 | 61.000 | 62.000 | 64.000 | 71.000 | 76.000 | 76.000 | 9.000 | 15.000 | 2.826 | 65.063 | °C | ||||
| Temp /dev/sdf | 55.000 | 55.000 | 56.000 | 58.000 | 64.000 | 68.000 | 69.000 | 8.000 | 13.000 | 2.621 | 58.772 | °C | ||||
| Temp LM0 | 28.750 | 28.750 | 29.000 | 31.250 | 34.750 | 41.500 | 47.250 | 5.750 | 12.750 | 2.150 | 31.582 | °C | ||||
| Temp LM1 | 41.500 | 42.000 | 42.500 | 44.000 | 46.500 | 46.500 | 47.000 | 4.000 | 4.500 | 1.215 | 44.323 | °C | ||||
| Temp LM10 | 0.000 | 0.000 | 0.000 | 0.000 | 0.000 | 0.000 | 0.000 | 0.000 | 0.000 | 0.000 | 0.000 | °C | ||||
| Temp LM11 | 44.000 | 44.000 | 45.000 | 47.000 | 49.000 | 50.000 | 52.000 | 4.000 | 6.000 | 1.347 | 46.926 | °C | ||||
| Temp LM12 | 27.800 | 27.800 | 27.800 | 27.800 | 27.800 | 27.800 | 27.800 | 0.000 | 0.000 | 0.000 | 27.800 | °C | ||||
| Temp LM13 | 29.800 | 29.800 | 29.800 | 29.800 | 29.800 | 29.800 | 29.800 | 0.000 | 0.000 | 0.000 | 29.800 | °C | ||||
| Temp LM14 | 30.000 | 30.000 | 30.250 | 32.500 | 35.500 | 38.000 | 41.750 | 5.250 | 8.000 | 1.767 | 32.781 | °C | ||||
| Temp LM15 | 55.000 | 55.000 | 56.000 | 58.000 | 64.000 | 69.000 | 69.000 | 8.000 | 14.000 | 2.631 | 58.939 | °C | ||||
| Temp LM16 | 61.000 | 61.000 | 61.500 | 63.500 | 66.000 | 69.500 | 71.500 | 4.500 | 8.500 | 1.648 | 63.810 | °C | ||||
| Temp LM17 | 61.000 | 62.000 | 63.000 | 65.000 | 72.000 | 76.000 | 77.000 | 9.000 | 14.000 | 2.795 | 65.282 | °C | ||||
| Temp LM18 | 55.000 | 55.000 | 56.000 | 58.000 | 63.000 | 68.000 | 68.000 | 7.000 | 13.000 | 2.495 | 58.164 | °C | ||||
| Temp LM19 | 27.000 | 28.000 | 28.000 | 30.000 | 34.000 | 67.000 | 80.000 | 6.000 | 39.000 | 4.937 | 31.174 | °C | ||||
| Temp LM2 | 33.000 | 33.000 | 33.000 | 36.000 | 38.000 | 38.000 | 41.000 | 5.000 | 5.000 | 1.386 | 35.640 | °C | ||||
| Temp LM20 | 26.000 | 27.000 | 28.000 | 30.000 | 34.000 | 65.000 | 80.000 | 6.000 | 38.000 | 4.762 | 30.699 | °C | ||||
| Temp LM21 | 24.000 | 25.000 | 25.000 | 28.000 | 31.000 | 61.000 | 76.000 | 6.000 | 36.000 | 4.588 | 28.494 | °C | ||||
| Temp LM22 | 25.000 | 26.000 | 27.000 | 30.000 | 34.000 | 60.000 | 73.000 | 7.000 | 34.000 | 4.464 | 30.531 | °C | ||||
| Temp LM23 | 26.000 | 27.000 | 27.000 | 29.000 | 33.000 | 59.000 | 72.000 | 6.000 | 32.000 | 4.160 | 30.014 | °C | ||||
| Temp LM3 | 31.500 | 31.500 | 32.000 | 34.500 | 37.000 | 37.500 | 37.500 | 5.000 | 6.000 | 1.642 | 34.432 | °C | ||||
| Temp LM4 | 24.000 | 24.000 | 24.000 | 24.000 | 24.000 | 24.000 | 24.000 | 0.000 | 0.000 | 0.000 | 24.000 | °C | ||||
| Temp LM5 | 30.500 | 30.500 | 30.500 | 30.500 | 30.500 | 30.500 | 30.500 | 0.000 | 0.000 | 0.000 | 30.500 | °C | ||||
| Temp LM6 | 61.000 | 61.000 | 61.000 | 63.000 | 66.000 | 69.000 | 71.000 | 5.000 | 8.000 | 1.704 | 63.522 | °C | ||||
| Temp LM7 | 0.000 | 0.000 | 0.000 | 0.000 | 0.000 | 0.000 | 0.000 | 0.000 | 0.000 | 0.000 | 0.000 | °C | ||||
| Temp LM8 | 0.000 | 0.000 | 0.000 | 0.000 | 0.000 | 0.000 | 0.000 | 0.000 | 0.000 | 0.000 | 0.000 | °C | ||||
| Temp LM9 | 0.000 | 0.000 | 0.000 | 0.000 | 0.000 | 0.000 | 0.000 | 0.000 | 0.000 | 0.000 | 0.000 | °C | ||||
| Temp ZONE0 | 26.000 | 27.000 | 28.000 | 30.000 | 34.000 | 67.000 | 81.000 | 6.000 | 40.000 | 5.006 | 30.873 | °C | ||||
| Temp ZONE1 | 27.800 | 27.800 | 27.800 | 27.800 | 27.800 | 27.800 | 27.800 | 0.000 | 0.000 | 0.000 | 27.800 | °C | ||||
| Temp ZONE2 | 61.000 | 61.500 | 61.500 | 63.500 | 66.000 | 69.500 | 71.500 | 4.500 | 8.000 | 1.645 | 63.812 | °C | ||||
| Temp ZONE3 | 29.800 | 29.800 | 29.800 | 29.800 | 29.800 | 29.800 | 29.800 | 0.000 | 0.000 | 0.000 | 29.800 | °C | ||||
This server:
CPU: Quad core Intel Xeon E3-1241 v3Kernel: config.gz
Motherboard: Supermicro X10SAE
OS: Gentoo stable
GPS; Meinberg GPS180PEX
GPS/PPS server: gpsd
NTP server: NTPsec
ntp.conf: current
ntp.log: current
